

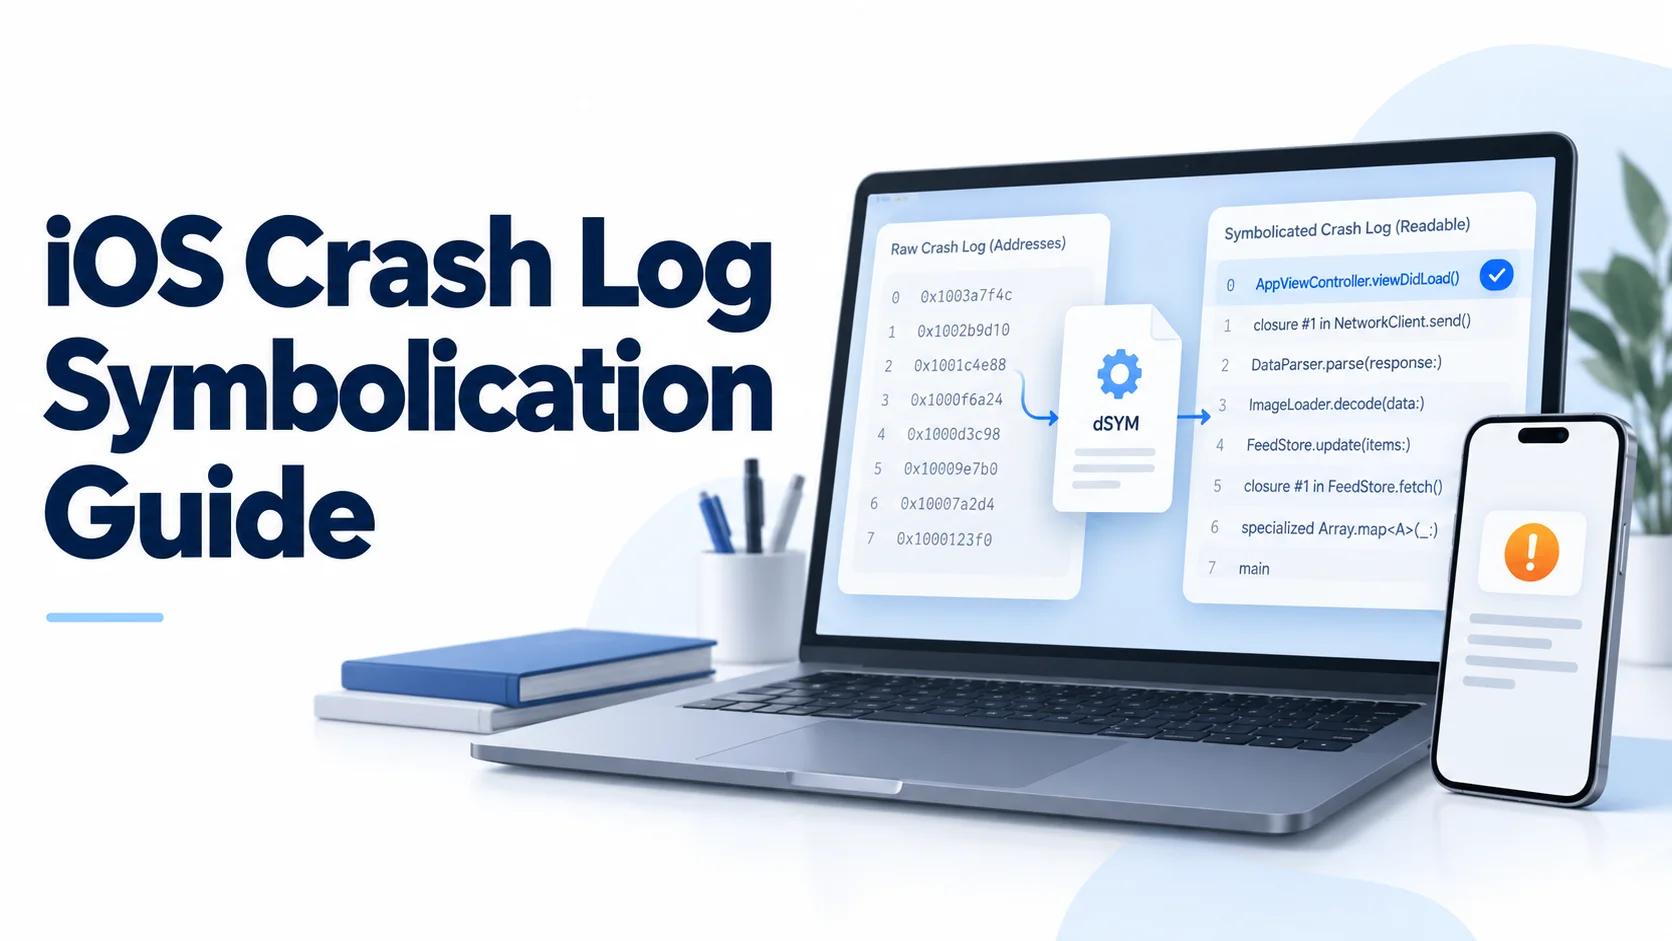
A TestFlight crash becomes actionable when you can connect its addresses to the exact binary your tester installed.
iOS crash log symbolication translates runtime addresses into function names and, when debug information permits, source locations. For a TestFlight or release crash, the essential question is whether you have symbols for the exact executable that failed. A similar build can send an investigation toward the wrong code.
This guide follows the engineering work after a crash arrives. For distribution planning, use the iOS app beta testing guide. Here, the goal is a trustworthy stack, a testable explanation, and a verified fix.
Follow a repeatable symbolication workflow
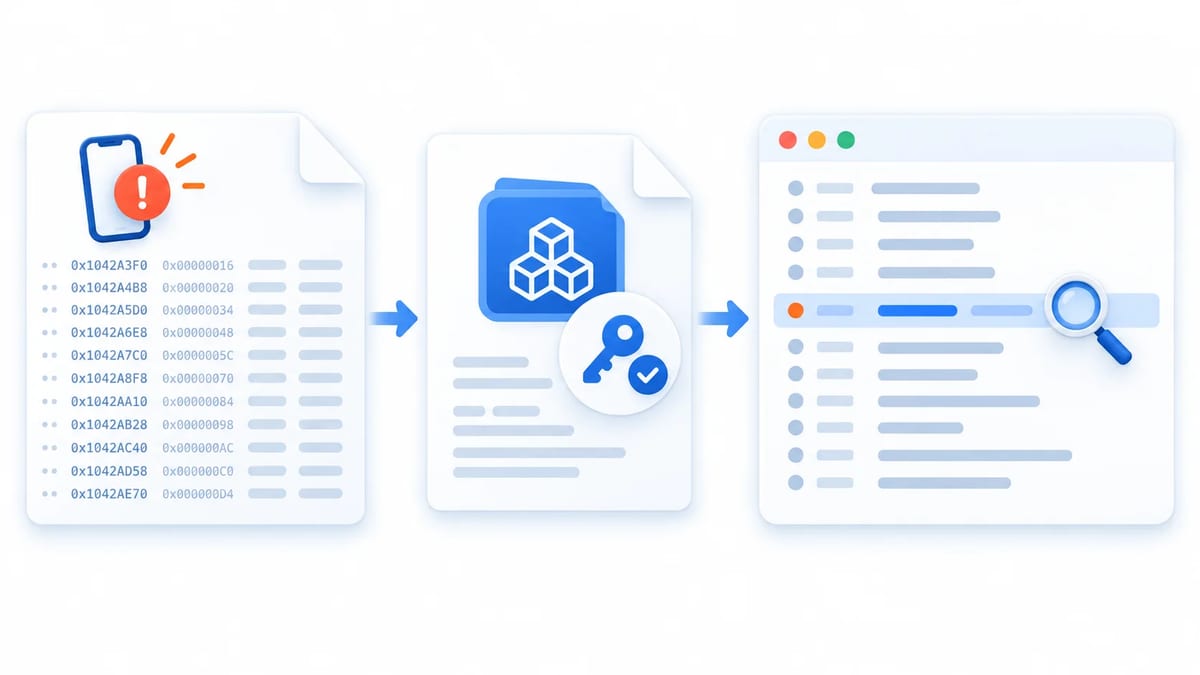
Keep the original report alongside your analysis. Record the build, device, OS version, incident time, and tester action in one investigation ticket. Separate artifact problems from code problems so a missing symbol file does not become a speculative bug diagnosis.
- Retrieve the complete Apple crash report.
- Identify the executable or framework behind each unresolved frame.
- Match its reported UUID and architecture to the retained binary and dSYM.
- Open the report in Xcode with the required symbols available.
- Read the termination details and relevant backtraces together.
- Reproduce the failure, fix its cause, and retest the same conditions.
For example, a crash after returning from the camera needs more context than “photo upload failed.” Preserve whether the app was backgrounded, the upload was interrupted, and the account had existing drafts. Those details turn a symbolicated function into an experiment.
Retrieve the full TestFlight or device crash report
Start in Xcode Organizer’s Crashes view for TestFlight or App Store builds. TestFlight users automatically share crash reports; App Store reporting depends on diagnostic sharing. To extract an Organizer report, use Show in Finder on the crash, open the resulting .xccrashpoint package, and locate the relevant .crash file.
When the report is unavailable, ask the tester to open Settings, Privacy & Security, Analytics & Improvements, then Analytics Data and share the app’s matching log. Collect the complete attachment rather than a screenshot. Apple’s report collection guidance also explains why watchdog, jetsam, thermal, and invalid code-signature events may require device logs instead of Organizer.
Preserve binary images and all threads. Redact private information before sharing. If reproducing under Xcode, detach the debugger to let the operating system finish generating a crash report. Pair the attachment with the steps described in the mobile app bug report guide.
Preserve the archive and generate release symbols
Check the distribution configuration’s Debug Information Format setting. Apple recommends DWARF with dSYM File, represented by DEBUG_INFORMATION_FORMAT = dwarf-with-dsym. Keep the complete .xcarchive for every distributed build, including its binaries and dSYMs. Include symbols when uploading to App Store Connect so reports can arrive with app symbols already resolved.
Apple’s debugging information guide explains that the app executable, extensions, and frameworks have separate symbol artifacts. Rebuilding the same source with different settings or an Xcode version can produce different UUIDs.
As a release practice, store the archive with the source revision, build number, toolchain version, and dependency lockfiles. Test retrieval from artifact storage before deleting a CI runner’s workspace. A successful upload does not prove your team can recover the symbols six months later.
Match the dSYM UUID and architecture exactly
Find the affected image in Binary Images. Record its UUID, architecture, and load address. For a JSON .ips report, identify the corresponding entry in usedImages. The marketing version and build number help locate candidates, but the image UUID decides compatibility.
Run xcrun dwarfdump --uuid "Release.xcarchive/dSYMs/TrailNote.app.dSYM/Contents/Resources/DWARF/TrailNote" and xcrun dwarfdump --uuid "Release.xcarchive/Products/Applications/TrailNote.app/TrailNote". Compare the UUID for the relevant architecture in both outputs with the report. A file containing multiple slices requires checking the matching slice, not accepting the first line.
Apple’s missing symbol file guide describes searching with mdfind "com_apple_xcode_dsym_uuids == YOUR-UPPERCASE-HYPHENATED-UUID". Substitute the actual UUID. Empty results can mean Spotlight has not indexed the archive, so inspect your stored artifacts directly before concluding the symbols are lost.
Suppose two archives both say build 84, but only one matches the crash UUID. Use that archive and investigate why your release process reused the number. Never select symbols solely because a filename looks right.
Open the report in Xcode and inspect unresolved frames
Apple’s current symbolication instructions describe opening an external .crash or .ips file in Xcode and choosing the applicable project when prompted. For a connected device, the current workflow uses Device Hub’s Reports tab and Crashes inspector. Older Xcode versions expose device logs through Devices and Simulators.
Check whether the frames you need now show meaningful names. A readable system frame above an unresolved app address does not establish that your app symbols loaded. Compare multiple frames from the same image and confirm that the recovered functions plausibly belong to the reported user journey.
Treat implausible output as a failed verification. A networking crash resolving entirely to an unrelated settings feature deserves another artifact check before anyone edits code.
Use atos for a focused address lookup
For one unresolved frame, select its image, runtime address, load address, and architecture. Point atos at the DWARF binary inside the matching dSYM, not the bundle directory.
Here is an illustrative app frame with runtime address 0x104008a20 and image load address 0x104000000. After verifying its UUID and arm64 slice, run xcrun atos -arch arm64 -o "Release.xcarchive/dSYMs/TrailNote.app.dSYM/Contents/Resources/DWARF/TrailNote" -l 0x104000000 0x104008a20.
The addresses in this example are placeholders. Copy yours from the same report. With -l, pass the runtime address without manually subtracting the load address again. A framework frame needs that framework’s load address and symbols.
In JSON reports, imageIndex selects the image and imageOffset is relative to its base. Add base and offset to obtain the runtime address. Apple’s JSON crash report reference documents this relationship; an offset alone is not the address used in the example.
Resolve partial stacks and third party framework symbols
Investigate unresolved images individually. If app frames resolve but a precompiled SDK’s frames do not, request symbols for the SDK binary UUID and architecture from its vendor. Sending only the SDK’s product version leaves room for multiple compiled artifacts.
Static library code linked into your executable is investigated through the final executable’s symbols. Do not assume every dependency needs a separate framework dSYM. Apple’s build settings reference distinguishes static library products when describing dSYM generation.
Unresolved Apple framework frames need system symbols matching the reported OS release and device architecture. Connect an appropriate device and let Xcode acquire its symbols, following Apple’s operating system symbol guidance.
For optimized release code, a recovered function may still lack a precise line or omit inlined context. Document the remaining uncertainty rather than treating a partially readable stack as complete proof.
Read the exception and crashed thread before changing code
Inspect Exception Type, Termination Reason, and diagnostic messages first. The Crashed Thread or Triggered by Thread field identifies where the exception originated. If present, read Last Exception Backtrace too. Apple’s crash report field reference explains these sections, while its exception guide distinguishes termination mechanisms.
An EXC_BAD_ACCESS report suggests investigating invalid memory access. An EXC_BREAKPOINT report near a Swift collection operation could justify testing an invalid index, but the signal alone does not prove that explanation. A system frame at the top can be the consequence of an invalid call from your app.
Write a falsifiable hypothesis. If a background refresh removes a row before its selection handler executes, try selecting the final row while refresh replaces the collection. Apple’s analysis guide supports reading exception details, messages, and backtraces together.
Reproduce the failure and verify the release fix
Use the same data shape, lifecycle transition, device class, and network conditions where possible. A Debug run that passes once is weak evidence for a timing-sensitive release failure.
- Reproduce the original sequence and record the failure conditions.
- Add a regression check at the boundary that violated its contract.
- Test the fixed release candidate with the original scenario and nearby edge cases.
- Return the build to the affected tester and monitor its new crash signature.
For the row-selection example, test an empty refresh result, repeated taps, and background return. Measure whether testers exercised those paths before interpreting an absence of crashes. If you need targeted device coverage, create a BetaRoast testing round with a specific retest mission.
Frequently asked questions
Can I symbolicate without the original dSYM?
Search retained archives, CI artifacts, and vendor symbol storage first. A newly compiled replacement is not a reliable match. If matching debug information is unavailable, existing names and termination details may help, but full source mapping can remain impossible.
Why does Xcode show symbols for only some frames?
Each loaded image has its own symbol requirements. Check which image owns the unresolved frames, then distinguish missing app or SDK symbols from unavailable operating system symbols.
Can I use a simulator dSYM for an iPhone crash?
Do not infer compatibility from an arm64 label. Simulator and device artifacts target different environments. Match the report’s image UUID and architecture to the distributed device binary.
Why does atos return an address or an unexpected function?
Recheck the image UUID, architecture, runtime load address, and inner DWARF path. Also confirm that a JSON offset was converted to a runtime address and that you did not apply the load adjustment twice.
Reliable iOS crash log symbolication starts with the complete report and the exact distributed build. Verify the UUID and architecture for each affected image, supply its matching symbols, and use Xcode to inspect the whole report. Treat atos as a focused address lookup with the correct runtime load address and DWARF file. Read the exception, termination details, and relevant backtraces together, then reproduce the failure and retest the fix under the conditions that exposed it. Preserve every distributed archive so the next crash remains diagnosable.