
A request can succeed at the API edge while a retry, broken context boundary, or delayed worker hides the reason users are still waiting.
OpenTelemetry tracing connects operations across services so engineers can investigate where a request spent time and which dependencies participated. A trace is useful only when its relationships, recorded outcomes, and delivery path are trustworthy. A beautiful waterfall can conceal missing workers, duplicate instrumentation, or a sampling decision made before the failure occurred.
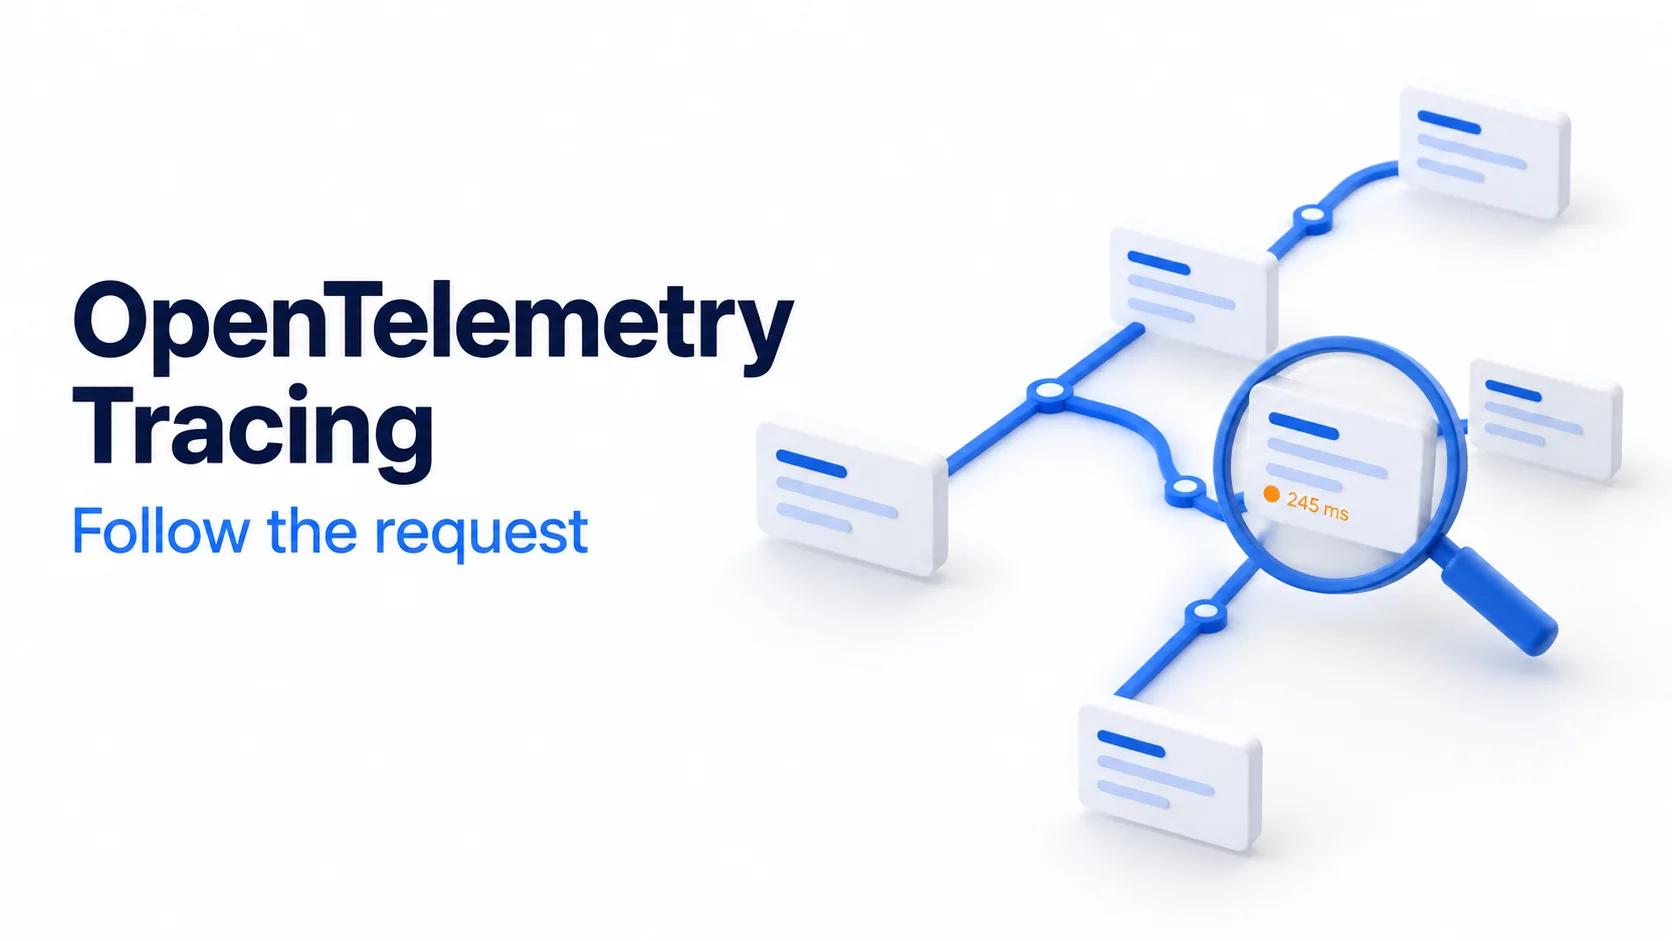
This guide develops a practical workflow for debugging distributed requests and reviewing release evidence. Scenarios and the cover's 245 ms label are hypothetical, not measured results. Start with one important journey, prove the telemetry path, and expand coverage after you understand its limitations.
Understand traces spans and request boundaries
Describe the operation each span represents
A span represents an operation with timing and contextual information; related spans form a trace. During investigation, use the trace ID to locate the correlated journey and a span ID to select the particular operation within it. Parent relationships, attributes, events, and links provide different kinds of evidence. The OpenTelemetry traces documentation explains these building blocks and span kinds.
Use a stable service name to distinguish producers of telemetry. Choose span names that describe operations, such as resolving an order, rather than inserting customer identifiers. Keep variable details in approved span attributes. High cardinality names fragment searches and make comparisons harder; unrestricted attributes can also create indexing costs in the backend.
In a hypothetical checkout, identify the inbound API request, outbound inventory call, database operation, and queued confirmation task. Decide which operation owns each duration. Concurrent children overlap, so adding every child duration does not establish total request latency. Inspect the critical dependency sequence and gaps before blaming the longest visible span.
Build a repeatable OpenTelemetry tracing workflow
Propagate context across synchronous calls
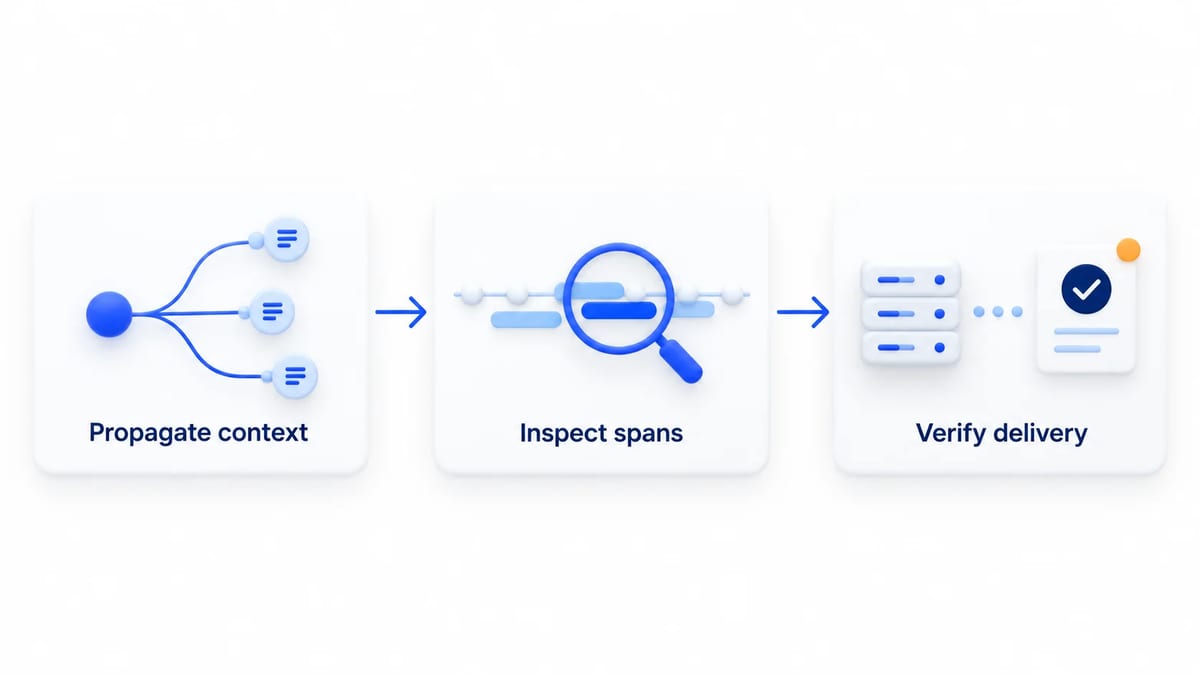
Context propagation transfers correlation information between execution boundaries. Inject trace context into the outgoing carrier and extract it at the receiving service using compatible propagators. Within a process, the context manager must preserve the active span across the concurrency mechanisms your runtime uses. See the context propagation guide for the relationship between context and distributed tracing.
For a hypothetical API integration, send a synthetic request through two services and inspect both sides of the boundary. Confirm that the receiving span shares the trace ID and references the intended upstream parent span. Compare the outbound headers with the receiver's extracted context. Matching timestamps alone do not prove causality.
Use missing context as a negative control
In a hypothetical control, remove propagation at one permitted test boundary. Your check should detect the disconnected downstream trace. Restore propagation and repeat with concurrent requests to detect accidental context reuse. A verification method that passes both connected and disconnected requests cannot establish integration quality.
Preserve asynchronous relationships with span links
Carry creation context in message metadata, then inspect the consumer's actual extraction behavior. Queue processing may involve batches, fan out, redelivery, or an existing ambient request. A single parent cannot faithfully represent multiple independent message origins. The messaging span conventions use span links to correlate message creation with consumption and describe when parent relationships are appropriate.
In a hypothetical batch worker, two messages arrive from different traces. Link processing to both creation contexts rather than choosing an arbitrary message as the parent. End the producer operation when publishing finishes; do not leave it open merely to encompass a worker that runs later. Verify that your backend exposes links before depending on them during incident investigation.
Establish instrumentation ownership and stable conventions
Initialize the SDK before instrumented libraries
Automatic instrumentation covers supported library operations; manual instrumentation adds domain boundaries that library hooks cannot describe. Inventory existing framework integrations before adding another SDK or agent. Assign ownership of inbound requests, clients, and domain operations so one action does not generate competing representations.
Startup timing matters. The Node.js setup guide requires instrumentation setup before application code. Check the equivalent requirements for your runtime and module system. An exporter configured correctly cannot repair library calls that escaped instrumentation during startup.
Pin compatible SDK, instrumentation, exporter, and Collector versions in the release record. Record the semantic convention version and migration settings too. OpenTelemetry semantic conventions establish common names, while telemetry stability requirements distinguish stable and unstable instrumentation output. Check the specific convention group and review emitted fields after upgrades instead of assuming dashboards will continue matching unchanged attribute names.
Suppress duplication without erasing real retries
Nested libraries can emit duplicate telemetry for one operation. The Java agent suppression guidance describes configurable suppression of overlapping instrumentation. That behavior is implementation specific; confirm what your installed agent actually suppresses.
In a hypothetical client request, a framework wrapper and underlying HTTP library both describe the same send. Inspect scope, timing, kind, and attributes before disabling instrumentation. Distinct retry attempts deserve separate evidence where supported, even when they share an endpoint. Removing every repeated span name would erase useful retry history. Keep the logical operation's outcome separate from each attempt's outcome.
Interpret errors according to operation semantics
Separate HTTP codes exceptions and span status
Span status is not a universal translation of an HTTP response code. The HTTP span conventions distinguish client and server behavior, including their treatment of 4xx responses. A failed connection can also produce an error without any response code.
The general error recording guidance distinguishes failed operations from errors handled within a successful operation and discourages repeated exception recording. That guidance is marked Development, so verify compatibility with your instrumentation and domain conventions.
In a hypothetical retry sequence, the first dependency attempt fails and the next succeeds. Preserve the failed attempt while evaluating the enclosing operation by its final outcome. Recording an exception and setting span status are separate API actions; inspect both rather than assuming one implies the other. An HTTP success can still accompany an incorrect business result, which requires a separate application assertion.
Configure the OpenTelemetry Collector as an explicit pipeline
Follow telemetry from reception to export
The SDK can export through OTLP to the OpenTelemetry Collector, which receives, processes, and exports telemetry. Defining a component is insufficient unless it is referenced in the relevant service pipeline. Processor order determines transformation order, as the Collector configuration documentation explains.
Review the deployed configuration and available components, not just a repository example. Check protocol compatibility, endpoint reachability, credentials, certificates, and whether the traces pipeline references the intended receiver and exporter. Investigate application export and Collector reception independently when spans disappear.
Ordering should express your policy. For example, establish required routing attributes before a routing decision, and remove prohibited data before any output that could expose it. Ensure sampling policies retain the attributes they need. Validate the particular processors' ordering guidance rather than copying a universal sequence into every deployment.
Debug with small synthetic payloads
The Collector troubleshooting guide describes using the debug exporter to inspect telemetry. Use a small synthetic trace in a restricted environment. Detailed output can expose attribute values and exception content through logs. Review the output destination and retention, then remove temporary debug export after inspection. Verify final backend ingestion separately from seeing a payload in Collector logs.
Choose sampling with explicit failure visibility
Distinguish head decisions from tail decisions
Head sampling decides early and cannot select a trace based on a future failure it has not observed. Tail sampling uses information from arriving spans to make a later decision. The OpenTelemetry sampling guide explains the different tradeoffs. Tail sampling cannot recover spans already discarded upstream.
Map the full route from every service to the sampler. Stateful trace processing needs trace affinity, meaning spans for a trace reach the same processing instance. Collector scaling guidance explains why ordinary load balancing can break that requirement. Check behavior during scaling and instance replacement, not only a quiet single instance run.
Test buffers late arrivals and policy outcomes
The tail sampling processor documentation describes decision timing, bounded trace storage, decision caches, and late spans. Late arrivals may inherit an earlier decision or be reconsidered after state expires. An error retention policy therefore does not establish universal capture of every error trace.
Exercise the decision boundary
In a hypothetical sampling check, compare a normal trace, an early failure, and a failure arriving after the decision window. Add a nonmatching trace as a negative control. Record expected retention and inspect the actual backend outcome. Repeat at representative load with approved synthetic traffic, monitoring early eviction, policy evaluation failures, CPU, memory, and export volume.
Set budgets from your workload. More buffering can improve visibility while increasing resource demand. Compare application latency and throughput with and without the proposed instrumentation under equivalent conditions. Report the tested conditions and observed overhead when you have measurements; there is no universal safe sampling percentage or zero overhead guarantee.
Protect sensitive attributes and bound delivery failures
Treat baggage as untrusted input
Baggage propagates metadata and is separate from span attributes. It can travel to unintended downstream services and has no built in integrity check, according to the baggage documentation. Never authorize a request using a tenant or role value received through baggage.
Define an allowlist for captured attributes and review headers, query strings, database statements, and exception messages. The sensitive data guidance discusses minimizing and processing sensitive telemetry. Prefer exclusion at instrumentation time, then apply defense in depth at collection. Hashing a predictable identifier does not automatically make it anonymous. Restrict backend access and retention according to the data actually present.
Verify queues retries and persistent storage
Export queues and retries absorb temporary disruption within configured limits. The Collector resiliency guide describes queue saturation, retry expiration, and file storage backed persistent queues using a write ahead log. Persistent storage can help across restarts, but disk exhaustion, storage loss, and longer outages remain relevant failure modes.
In a hypothetical outage check, interrupt the test backend, send a bounded batch, restore connectivity, and inspect recovery. Separately restart the Collector when persistent storage is configured. Compare expected spans with ingested spans and account for duplicates as well as loss. A queue is not an exactly once delivery contract. SDK shutdown and flushing also need verification for short lived processes.
Use traces as release evidence alongside assertions and feedback
Connect technical findings to the visible outcome
Keep a release record with build identifier, dependency versions, configuration, synthetic inputs, expected relationships, trace IDs, and observed results. Separate application assertions from telemetry checks. A connected trace proves correlation was observed; it does not prove the correct item was charged, access was authorized, or the confirmation reached the user.
Use the webhook testing guide for delivery and redelivery behavior and the API rate limit testing guide for throttling and recovery expectations. Pair trace inspection with those checks so a visible retry has an independently verified outcome.
Create a BetaRoast feedback round with safe accounts and a concrete user mission. Ask people whether waiting states, error explanations, and recovery actions are understandable. With consent, retain an approved correlation reference for engineering investigation. BetaRoast supports human feedback on the visible experience; engineers remain responsible for instrumentation, observability, and correctness verification.
Frequently asked questions
What is OpenTelemetry tracing?
It records operations as spans and correlates their relationships across services. Engineers use the resulting traces to investigate dependency behavior and latency, provided instrumentation, context propagation, sampling, and delivery have been verified.
How do you debug a disconnected trace?
Compare outgoing context with extraction at the next boundary, then inspect runtime context preservation and parent identifiers. Check export and sampling separately. For asynchronous processing, verify intended span links before treating a separate trace as a defect.
Does tail sampling capture every error trace?
No universal guarantee follows from an error policy. Upstream drops, missing affinity, exhausted buffers, late arrivals, and delivery failures can remove evidence. Test matching failures and negative controls through the complete deployed route.
Can distributed tracing replace integration tests?
Tracing helps explain what an observed request did. Integration tests assert what should happen. Use both, then review the visible experience with people when clarity and recovery behavior influence release quality.
Build tracing evidence around a defined request journey. Verify propagation, span ownership, semantic conventions, error meaning, sampling decisions, and delivery independently. Use synthetic controls and bounded outage checks, then connect the trace to release assertions and human feedback on the visible experience. BetaRoast supports that feedback round; it is not a telemetry platform.