

A green latency percentile means little when the test sent less traffic than intended or returned the wrong result quickly.
k6 load testing helps engineers evaluate whether an application delivers correct results under defined traffic. Grafana k6 provides open-source load testing with JavaScript test scripts, configurable workloads, and measurable acceptance criteria. The engineering work is deciding what those measurements actually establish.
A fast response can contain incorrect data. A quiet backend can reflect an exhausted load generator. An acceptable aggregate percentile can hide a slow critical journey. This guide explains how to build evidence for performance decisions rather than merely produce a passing report. Every example scenario and numerical illustration below is hypothetical, not a benchmark result.
Define the workload before writing the test script
Model journeys rather than isolated endpoints
Start with a decision, such as whether a release can sustain the expected checkout workload within its product budgets. Define the system under test, traffic origin, journey mix, data distribution, and relevant dependencies. Specify which operations must complete correctly and which failures users can recover from.
In a hypothetical commerce scenario, browsing, searching, and submitting orders have different costs. Repeating one cached catalog request does not represent that workload. Include representative payload sizes, account states, and key popularity. Document excluded dependencies so nobody mistakes a stubbed payment service for evidence about the complete deployment.
Choose an open or closed execution model
In a closed model, each virtual user finishes an iteration before beginning another. Slower responses therefore reduce the iteration rate. An open model schedules iteration starts independently of completion, subject to available VUs. The official execution model guide explains why closed models can conceal demand during slowdown.
Use a closed model when a bounded population and its behavior are the intended experiment. Use an arrival rate executor when incoming demand should continue despite slower service. Neither model is universally better. Record the choice because changing it changes the question your test answers.
The constant arrival rate executor schedules iterations using rate and timeUnit. The scenario's exec selects the exported journey function. This rate is not HTTP requests per second. In a hypothetical journey containing three requests, ten iterations per second imply roughly thirty requests per second only if every journey follows that path without extra requests. Retries, redirects, early failures, and conditional branches alter the actual request count.
Build a repeatable k6 load testing workflow
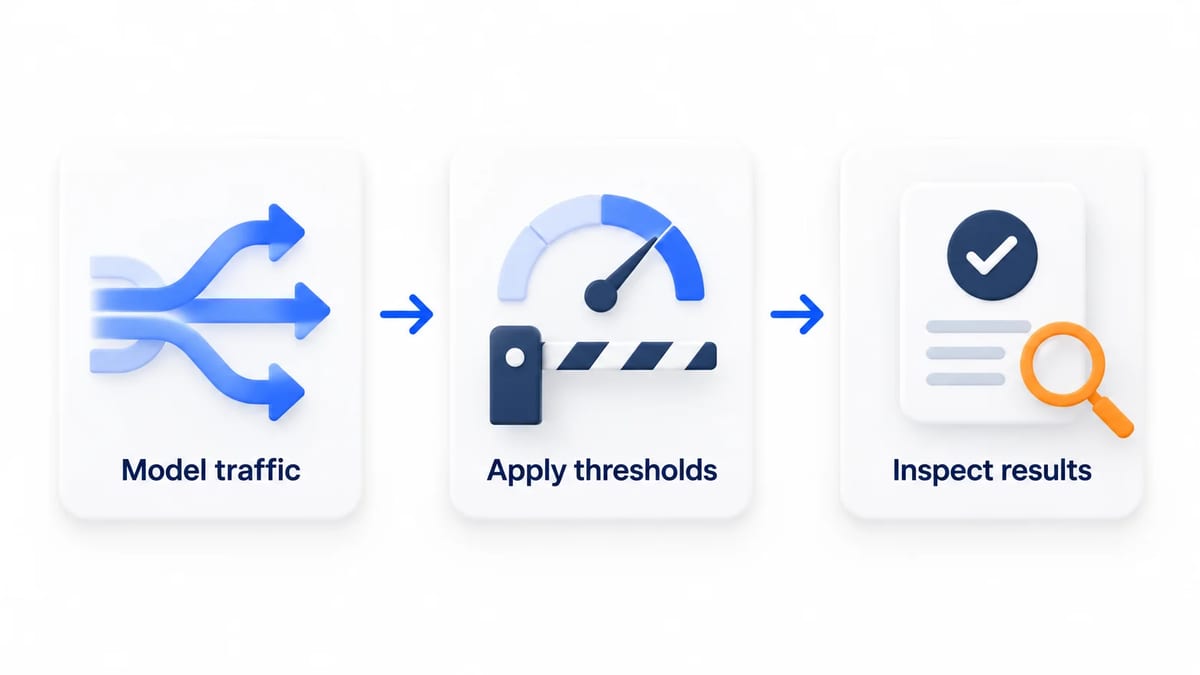
Establish traffic correctness and measurement together
Model traffic with enough allocated VUs
An arrival rate needs enough VUs to execute overlapping iterations. Estimate concurrency from arrival rate multiplied by iteration duration, then validate with margin for variability. In a hypothetical case, twenty starts per second with two seconds of occupied VU time suggests about forty busy VUs before allowing headroom. This is an allocation estimate, not proof of capacity.
The VU allocation documentation explains preAllocatedVUs and the costs of allocating additional VUs during execution. Preallocate from pilot evidence and verify generator capacity. Raising maxVUs cannot compensate for an injector already constrained by CPU or networking.
Track dropped_iterations explicitly. With arrival rate executors, unavailable VUs cause scheduled iterations to be dropped; other executors have different causes, including duration limits. Consult the dropped iterations reference. Report scheduled demand, achieved starts, completed iterations, and drops together. A run that silently reduces offered load cannot establish that the service met the original target.
Apply thresholds to meaningful outcomes
Checks evaluate individual conditions, such as the expected status and response content. Failed checks alone do not cause k6 to finish with a failed status. The checks documentation describes combining checks with thresholds when correctness must affect the result.
In a hypothetical order API, validate the returned order identifier and expected state, not just a 200 response. Safely handle malformed bodies so one parse failure is recorded deliberately. Include checks on error responses when testing recovery, and stop dependent journey steps when their prerequisites fail.
Inspect results before accepting the gate
Review whether expected checks and journey metrics received samples. Confirm that the configured traffic actually ran and that the observed endpoint mix matches the plan. Reconcile k6 requests with ingress telemetry, allowing for redirects, retries, sampling, and requests rejected before reaching the application.
Keep these validations separate from latency acceptance. A green threshold can describe a valid measurement while the experiment itself is invalid. Save the run configuration, effective options, exit status, and generator telemetry alongside the test results so reviewers can examine both.
Set k6 thresholds and interpret each performance metric
Separate request timing from user outcomes
The built in metrics reference defines http_req_duration as sending plus waiting plus receiving time. It excludes initial DNS lookup and connection time. Inspect http_req_blocked, http_req_connecting, and http_req_tls_handshaking separately when diagnosing startup or connection costs. Request duration is not a complete measure of the user's wait.
Measure a journey from its defined start to its defined outcome when several requests, retries, or polling steps matter. Create a custom Trend in init and add elapsed measurements in VU code, following the custom metrics guide. Record completion and failure counts too. A successful journey latency distribution needs the failures beside it, otherwise missing completions can make performance look better.
Tag operations with stable journey and step names. The tags and groups documentation explains how tags filter metrics and threshold scope. Avoid account identifiers or unique order IDs as metric dimensions. Apply critical journey budgets to their own populations rather than letting plentiful fast reads dominate an overall percentile.
Distinguish HTTP failure classification from correctness
http_req_failed reflects the response callback's classification. By default, statuses from 200 through 399 are expected; body correctness is separate. The response callback reference also explains how redirects participate in classification.
Choose expected statuses for each operation's contract. In a hypothetical throttling experiment, an expected rejection can be correct behavior while still preventing the business journey from completing. Report both facts. Marking every response expected to suppress errors would remove useful evidence; assuming every HTTP success is a correct product outcome would do the same.
Use thresholds without hiding warmup or sparse samples
Set latency, correctness, and error budgets from product requirements. No universal p95 limit fits every API. The thresholds reference documents tagged criteria, failed run status, abortOnFail, and delayAbortEval.
Use early aborts to bound harmful experiments, with separate operational stop criteria for resource exhaustion. delayAbortEval postpones abort evaluation; it does not remove warmup samples from the metric. Separate warmup and measurement through deliberate runs or metric tagging, and verify the selected population. Require sufficient observations for critical journeys before interpreting a percentile. An aborted run describes what happened before stopping, not sustained success at the planned load.
Prepare safe k6 authentication and isolated test data
Respect the k6 execution lifecycle
Load fixtures and declare metrics in init. Use setup for preparation that needs network calls, and put measured journey work in the selected VU function. The test lifecycle documentation explains that setup data reaches VUs as independent copies. A mutable module variable is VU scoped, not a shared coordination mechanism.
Assign synthetic accounts and records deliberately. Do not use a local incrementing counter as a global unique allocator across VUs or generators. Validate ownership and collision behavior in a smoke run. Decide whether authentication belongs in each measured journey, occurs once per VU, or is prepared ahead of time. That choice changes identity service demand and the meaning of the measurement.
Supply secrets through the approved runtime mechanism and redact headers, tokens, and bodies from logs. Use restricted synthetic credentials with suitable expiry. Test refresh explicitly when session lifetime matters. Shared credentials can distort cache behavior or trigger account limits, while bypassing authentication can remove a real bottleneck.
Real write endpoints can send email, reserve stock, charge accounts, and trigger background jobs. Use an isolated environment with synthetic data and controlled downstream services. Keep production outside the default load test workflow. Define cleanup and recovery independently of teardown, because an interrupted run may leave records behind.
Progress through distinct load conditions
Give each performance testing run one purpose
Begin with a smoke test to verify scripts, credentials, assertions, and telemetry at minimal demand. Then run expected load to evaluate normal service budgets. A stress test explores behavior beyond expected demand, a spike test examines abrupt changes, and a soak test investigates sustained operation. The official load test types guide distinguishes these purposes.
Use separate acceptance criteria rather than a single composite pass. In a hypothetical stress experiment, graceful rejection and recovery might matter more than meeting normal latency budgets throughout overload. Observe queue drainage and recovery after demand falls. In a hypothetical soak experiment, monitor memory growth, connection accumulation, token refresh, and storage growth across the relevant operational cycles.
Control overlapping jobs, autoscaling settings, deployment changes, and shared dependencies. Record which resource ceilings are intentional. A small staging environment can reveal performance regressions, but its capacity limit does not automatically predict production capacity. State the limits of that comparison.
Verify the load injector before blaming the backend
Correlate internal and external telemetry
Monitor injector CPU, memory, network throughput, connection errors, file descriptor usage, and container limits. Large bodies, verbose logging, and expensive script processing can consume resources independently of the application. The large test guidance discusses generator monitoring and operating system constraints. Its illustrative capacity figures are not guarantees for your script or hardware.
Compare k6 throughput with gateway counts, service latency, database activity, queue depth, and dependency errors over aligned windows. Investigate clock alignment and measurement boundaries when they disagree. Low server CPU does not prove spare capacity if a connection pool, quota, lock, or downstream service is limiting throughput.
If generator constraints are plausible, repeat a bounded equivalent workload with verified injector headroom. A changed outcome calls for investigation, not an immediate capacity claim. Preserve traffic origin and routing assumptions when distributing execution, since additional generators can also change network paths and account allocation.
Compare k6 test results and review the visible experience
Preserve comparable baselines for performance regressions
Store the application build, k6 version, script revision, fixture version, environment limits, workload mix, and cache state with each baseline. Test cold and warm cache conditions separately when both matter. Change one relevant variable at a time where practical, and repeat surprising outcomes before attributing them to a release.
The end of test documentation describes aggregated summaries. Retain time series when a summary would conceal bursts or degradation. Compare p95 within the same journey population and report sample counts. Do not average percentiles from independent runs or generators to obtain a combined percentile; merge suitable observations or compatible distributions instead.
Sparse tails remain uncertain even when displayed precisely. A rare journey needs deliberate coverage, and a whole run aggregate can bury a short failure interval. Review time windows, error categories, and successful completion rates together. A baseline is evidence under recorded conditions, not a permanent promise.
Use the API rate limit testing guide for rejection and recovery behavior and the OpenTelemetry tracing guide to investigate backend request paths. These complement the workload evidence with more specific failure analysis.
Finally, create a BetaRoast feedback round using safe accounts and a visible user mission. Ask people whether waiting states, retry messages, and recovery actions are understandable. BetaRoast supports human feedback on the experience. Engineers remain responsible for generating load, verifying correctness, interpreting telemetry, and making the performance decision.
Frequently asked questions
What is k6 load testing used for?
It evaluates application behavior under a defined workload. A useful run connects achieved traffic to correctness, latency, errors, and resource evidence so engineers can assess a specific release or capacity question.
Does arrival rate equal HTTP requests per second?
No. Arrival rate schedules iteration starts. One iteration can make several requests or none after a prerequisite failure. Retries and redirects also change HTTP volume. Inspect achieved starts and actual request counts separately.
Do failed checks fail a k6 test?
Failed checks record unsuccessful conditions but do not alone fail the run. Add an appropriate threshold when those conditions must determine pass or fail, and verify that the expected checks actually received samples.
Why can a passing load test still be misleading?
It may have dropped scheduled iterations, measured incorrect responses, exhausted the injector, or combined incompatible populations. Validate the experiment and sample coverage before accepting its thresholds as release evidence.
Reliable k6 load testing connects a defined workload to verified traffic, correct responses, journey budgets, and sufficient samples. Inspect dropped iterations and injector limits before judging backend capacity. Compare equivalent versioned runs, then use BetaRoast for human feedback on the visible waiting and recovery experience.